


The Canadian Vanguard Stock Market Report At Close – Friday, November 24, 2023
.
Your Market Report And Analysis For Tomorrow’s Market Winning Trades And Profitable Investing
.
The Toronto Market
![]()
The TSX composite index was down -13.55 points or -0.07% to close at 20,103.11. The TSX traded within a fairly narrow range, within single digit in points and generally bounded by -0.1% and 0.1% during most of this week. The market appears not able to decide whether to move up or down. The bull trend is in full throttle, however, it is actually a good sign that the market is trading sideways within a narrow range for now and while it tries to decide which direction, to resume the upward climb or to decline. The good s news is that the stock with gains are not being extended. Extended climbs often end up in sharp declines – correction. Volume was down again today but given that yesterday was Thanksgiving in the US and today was a half a trading day at US markets, a lower volume is not unusual for the market following Thanksgiving.


There were neither giant gains and nor sharp declines among the major sectors at the Friday’s market. Healthcare, up 0.27%, was the top gainer among the sectors. Basic Materials was up 0.14%; Energy was up 0.08%; Financials was up 0.06% while Durable Consumer Goods & Services gained 0.01%. Industrials was down -0.06%; Technology was down -0.33% and Utilities was down -0.48%.
Coal was the top industry at the TSX on Friday with a gain of 6.05%. Coal industry continues to gain routinely. Medical Equipment, Supplies & Distribution gained 3.17%; Hotels, Motels & Cruise Lines gained 2.7%; Insurance – Multiline gained 2.2% and Advertising / Marketing gained 2.11%. Computer Hardware was the worst performing industry with -8.35% decline on Friday; Aluminum was down -5%.
For the week, the Technology was the top gaining sector with 1.17% gain for the week. Basic Materials gained 0.93% and Healthcare gained 0.39% while Utilities was the worst performing sector declining -1.56% for the week.
Today’s Statistics: The declined issues (decliners) very marginally outnumbered the gaining issues (advancers) by a ratio of 1.01-to-1. In real numbers, 668 decliners to 662 advancers with 251 Unchanged. The total volume of shares traded for gaining stocks was 85,266,583 or 45.6%; the total volume for declined stocks was 88,042,135 or 47.1% and 13,800,674 or 7.4% for “Unchanged”.
There were 72 new 52-Week Highs and 16 new 52-Week Lows. That is bullish and quite positive, contributing some points to our decision make the call that the bullish trend remains intact.
The total volume of stocks traded at the TSX today was 187,109,392 compared with 291,523,731 on Wednesday, a thirty six percent decrease in volume. Today’s volume of 187,109,392 is about 30% lower than the average of the most recent ten-market sessions. The volume should be ignored, the relatively low volume of share traded during the session was the result of the day following Thanksgiving holiday is a scheduled half day market session in the US.
The US Markets
![]()
The Dow Jones Industrial Average closed up 117.12 points, or 0.33%, to close at 35,390.15. The S&P 500 gained 2.72 points, or 0.06%, to close at 4,559.34. The Nasdaq Composite gained 15.00 points or 0.11%, to close at 14,250.85.

The US markets were broad-based positive but given that the bull market is going for over two weeks, the real story on Friday was in the volume of shares traded. Volume on the NYSE was down 45.9% or 14M and on the NASDAQ the volume was down down 33.1% or -13M.
The gains at the US markets today was broad based as nine of the major sectors ended in green. Technology with -0.28% decline was the only sector which ended in red. Energy with 0.75% gain was the top gaining sector; Healthcare followed with 0.74% gain; Telecommunication Services was up 0.67%; Financials gained 0.54%; Industrials gained 0.32% and Basic Materials gained 0.16%.
For the week, all the major US major sectors ended in green. Energy was the top gainer for the week with 2.81% gain; Healthcare gained 2.41%; Telecommunication services gained 1.9%; Industrials gained 1.74%; Financials gained 1.73%; Basic materials gained 1.57% and Technology gained 0.92%.
The top performing industry on Friday was Retail – Department Stores with 2.12% gain. Oil & Gas Drilling gained 1.88%; Airport Services gained 1.72%; while Marine Transportation gained 1.68% and Textiles & Leather Goods gained 1.65%. Consumer Electronics was the worst performing industry declining -0.99% while Paper Products declined -0.61% and Communications Equipment declined -0.54%.
Today’s Market Statistics: Today, the gaining issues (advancers) completely outnumbered the declined issues (decliners) on the NYSE. The ratio of decliners to advancers on the NYSE was 2.64-to-1. In real numbers, 2,620 advancers to 991 decliners with 321 “Unchanged”. The total volume of volume-gaining stocks was 293,606,886 or 73.9%; the total volume of declined-volume stocks was 97,073,372 or 24.4%; and 6,607,048 or 1.7% “Unchanged”.
There were 145 new 52-Week Highs and 22 new 52-Week Lows.
The total volume of stocks traded on the NYSE today was 397,287,306 compared with 748,107,320 yesterday, a 47% increase or about one half. Yesterday we mentioned that investors largely took a pass, today even many more investors stay away compared to yesterday. Today’s total volume, of 748,107,320 shares traded was about 30% below the average of the most recent ten-market sessions.
On the NASDAQ, the advancers outnumbered the decliners. The ratio of decliners to advancers on the NYSE was 2.32-to-1. In real numbers, 2,895 advancers to 1,248 decliners with 391 “Unchanged”. The number of advancers was more than double the number of decliners. The total volume of volume-gaining stocks was 1,868,648,492 or 72.1%; the total volume of declined-volume stocks was 645,270,483 or 24.9% and 79,100,367 or 3.1% for “Unchanged”.
There were 92 new 52-Week Highs compared to 59 new 52-Week Lows.
The total volume of stocks traded today on the NASDAQ was 2,593,019,342 compared to 3,946,029,898 on Wednesday, a 35%, slightly higher than one third decrease. The volume of stocks traded today at 2,593,019,342 was 30% lower than the average volume of the ten most recent market sessions.
10 –year Treasury Yield: The 10-year Treasury yield rose slightly to 4.5%.
The market outlook remains uptrend positive.
Regular Market Day Features
Beginner Investor’s (Canadian stocks) Watchlist
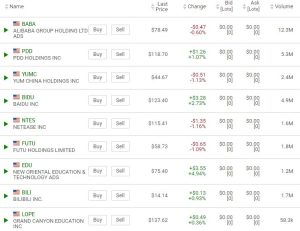
The Canadian Vanguard Chinese Stocks Watchlist

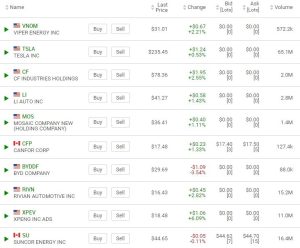
EV, Energy and Resource Stocks Watchlist
IMPORTANT NOTICE
Readers are reminded that the market’s performance at the following day’s market session may completely differ from the market performance at the overnight markets.
SUBSCRIPTION Offer: We thank you for following our Stock Market posts but please be aware that we shall soon be restricting these articles to subscribers only.
We do not send this publication by email to readers. If you receive a copy by email please simply forward the email to us.