


The Canadian Vanguard Stock Market Report At Market Close – Friday, March 1, 2024
.
Data Driven Market Analysis And Report For The Week Ending March 1, 2024
The Toronto Market As At Friday March 1st.
![]()
The TSX advanced a further 188.74 points or 0.88%, a follow-up to Thursday’s 119.84 points climb, to close Friday’s market session at 21,552.35. The US S&P 500 and even NASDAQ have been sort of on a roll for some time. The TSX index has not so far participated in those daily climbs to new heights. We shall keep fingers crossed, but be on lookout in case things are about to change especially given the size of today’s volume.


The market, on Friday, was genuinely broad-based. Only one of the major sectors, Discretionary Consumer Goods & Services, ended the market session in red (decline). Basic Materials was the top performing sector. The sector was up a respectable 2.30%. Energy gained 1.39%; Healthcare gained 1.37%; Technology gained 0.96%; Industrials was up 0.82%; Financials gained 0.46% and Utilities gained 0.37%. The gains were relatively appreciable.
Computer Hardware lead the industries with a muscular 8.94% gain; Electrical Components & Equipment industry was up 5.56%; Chemicals – Specialty gained a respectable 5%; Oil & Gas Drilling was up 4.85% while Paper Products gained 4.74%.
For the week, the sectors’ performances were relatively weaker as only four sectors gained for the week. Energy was up 2.94% while Basic Materials gained 2.59% for the week. Technology gained 1.41% and Industrials was up 0.58%. Telecommunications Services declined -1.33% while Discretionary Consumer Goods & Services declined 0.92% and Financials declined -0.15%.
Today’s Statistics: The gaining issues (advancers) dominantly outnumbered the declined issues (decliners) again today. The ratio of advancers to decliners was 4.33-to-1.0 or in practical terms, for every four advancers there was one decliner. It was a lopsidedly bullish performance. In real numbers, 1,240 advancers to 286 decliners to with 101 Unchanged. The total volume of shares traded for gaining stocks was 389,427,743 or 61.9%; the total volume for declined stocks was 217,556,016 or 34.6% and 22,518,005 or 3.6% for “Unchanged”.
There were 385 new 52-Week Highs and 18 new 52-Week Lows.
The total volume of stocks traded at the TSX today was 629,501,764 compared to 342,029,307 on Tuesday, an 84% increase, almost double. Today’s volume of 629,501,764 was fifteen percent higher than the average of the ten most recent market sessions. A daily volume of over six hundred million shares traded is not a common occurrence at the TSX.
The volume today was almost double the daily average. The market session was positive and was supported by large increase in volume of shares traded.
The US Markets
All three US indexes were up Friday making two consecutive days of all indexes up. Volume was down a good percentage today though. Yesterday saw bumper volumes increases indicating good market participation and support at Thursday’s market session.
The Dow Jones Industrial Average was up 90.99 points, or 0.23%, to close at 39,087.38. The S&P 500 gained 40.81 points, or 0.80%, to close at 5,137.08. The Nasdaq Composite was up 183.02 points or 1.14%, to close at 16,274.94. The gains today came with reduced volume compared to Thursday’s market session. However, the volumes on Thursday were more than ten percent higher than on Wednesday. Today’s volumes were about average, even though down compared to Thursday’s volumes.

The market today was positive and broad-based. Eight of the major sectors were up at the market close today. Technology up 1.57% was the top performer; Energy followed with 1.26% gain; Healthcare was up 1.17%; Basic Materials was up 0.73%. Durable Consumer Goods & Services was up 0.51%; Industrials was up 0.35% while Financials gained 0.26%. Discretionary Consumer Goods & Services declined -0.11% while Utilities ended the session declining -0.51%.
Computer Hardware industry, up a robust 11.46% was the top performing industry at the US markets just as it was the top performer today at the Canadian TSX market. Marine Port Services followed with 6.45% gain. Semiconductors was up 4.22%; Semiconductor Equipment & Testing was up 4.18% while Oil & Gas Drilling was up 3.93%.
On a weekly basis, seven of the sectors gained this week. Durable Consumer Goods & Services, up 2.26% was the top performing sector. Technology was up 2.23%; Basic Materials was up 1.39%; Financials was up 1.29%; Energy was up 0.93% and Industrials was up 0.82% while Utilities sector was up 0.29% for the week. Healthcare and Telecommunication Services ended the week with -0.15% and -0.54% respectively.
Today’s Market Statistics: Today, the gaining issues (advancers) outnumbered the declined issues (decliners) on the NYSE by a ratio of 2.28-to-1 or there were roughly eleven advancers for every five advancers. In real numbers, there were 2,833 advancers to 1,238 decliners and 238 “Unchanged”. The total volume of volume-gaining stocks was 725,068,588 or 65.7%; the total volume of declined-volume stocks was 365,206,244 or 33.1%; and 12,569,554 or 1.1% “Unchanged”.
There were 701 new 52-Week Highs and 61 new 52-Week Lows. Today’s market, in this respect couldn’t be any more bullish.
The total volume of stocks traded at the NYSE today was 1,102,844,386 compared with 1,809,277,268 yesterday, quite a significant decline. Today’s volume of 1,102,844,386 is slightly higher than the average of the ten most recent market sessions.
On the NASDAQ, the advancers outnumbered the decliners today by a ratio of 1.58-to-1 or roughly for every eight advancers there were five decliners. In real numbers, there were 2,633 decliners to 1,662 advancers with 404 unchanged. The current rally continues to roll on. The total volume of volume-gaining stocks was 3,656,909,066 or 65.7%; the total volume of declined-volume stocks was 1,844,746,559 or 33.1% and 66,677,551 or 1.2% for “Unchanged”.
There were 390 new 52-Week Highs and 88 new 52-Week Lows. The current rally remains very much alive.
The total volume of stocks traded at the NASDAQ today was 5,568,333,176 compared to 6,455,543,235 on Thursday, a fourteen percent decrease. Today’s volume of 5,568,333,176 is about the average of the last ten market sessions.
Oil Price: U.S. crude oil futures was up as of March 2nd at $79.97 a barrel. Oil has been inching towards the $80 price as Saudi Arabia, Russia and several OPEC producers extend voluntary crude supply cuts until end of June.
10 –year Treasury Yield: The 10-year Treasury yield declined 8 basis points to 4.186%.
The market outlook remains confirmed uptrend.
.
Regular Market Day Features
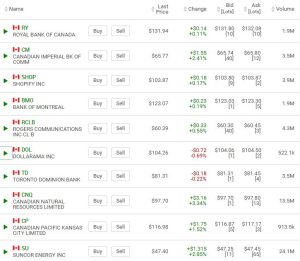
Beginner Investor’s (Canadian stocks) Watchlist
Canadian Imperial Bank of Commerce (TSX:CM) is a stock to keep an eye on, at least in the short term, within this watchlist. The stock was down most of last year but has recovered and has been up almost ten percent the last two weeks. The CM stock pays good dividend. The dividend yield is currently around 4.57%. If the price continues to rise then the dividend amount will have to increase to maintain the current dividend yield.
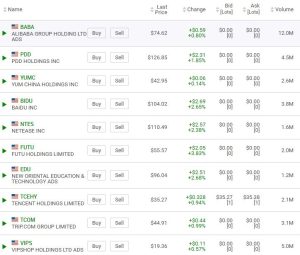
The Canadian Vanguard Chinese Stocks Watchlist
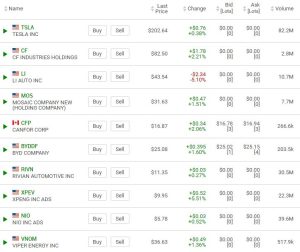
EV, Energy and Resource Stocks Watchlist
For readers concerned by over extended prices of the big cap technology stocks and the likelihood of a pullback and are looking at small caps as alternative for investment, Viper Energy Inc. (VNOM) is worth keeping an eye on. The stock also pays relatively good dividends.
IMPORTANT NOTICE
Readers are reminded that the market’s performance at the following day’s market session may completely differ from the market performance at the overnight markets.
SUBSCRIPTION Offer: We thank you for following our Stock Market posts but please be aware that we shall soon be restricting these articles to subscribers only.
We do not send this publication by email to readers. If you receive a copy by email please simply forward the email to us.
Our reports are composed by humans after proper analysis and detailed research. It is neither AI nor machine generated. We do not, unlike AI, make things up.