


The Canadian Vanguard Stock Market Report At Market Close – Friday, March 8, 2024
.
Your Week End Data Driven Market Analysis And Report
The Toronto Market As At Friday March 8.
.
![]()
The TSX declined -57.03 points or -0.26% to close today’s market session at 21,737.53. The decline was kind of expected and is welcome. The market was on a roll the last two days so a small decline should be considered normal. Some investors probably decided to take some profits off the table especially as the Bank of Canada announcement this week that made it clear that lowering interest rates may not come until much later in the year.


Only three of TSX’s major sectors ended the market session in green (gained) on Friday. The gains were paltry. Technology was the top performer of the sectors but gained only 0.11%; Healthcare was up 0.085 and Utilities gained a mere 0.05%. Industrials was down -0.15%; Financials was down -0.20%; Discretionary Consumer Goods & Services declined -0.26%; Basic Materials declined -0.35% and Energy was down -0.59%. The spread between the gainers and the decliners was relatively narrow reflecting the market performance.
Basic Materials, up 4.46% for the week, was the top gaining sector this week. Utilities sector was up 2.27%; Financials sector was up 0.96% and Durable Consumer Goods & Services was up 0.95%; Energy was down -0.21%; Technology was down -0.86%; Discretionary Consumer Goods & Services was down -0.73%; Telecommunications Services was down -1.66% and Healthcare declined -4.68%.
Aluminum, up 5.56%, was the top performing industry on Friday; Consumer Electronics gained 5.26%; Coal gained 3.83%; Highways & Railtracks was up 2.02% while Utilities – Multiline gained 1.57%. The worst performing industry was Computer Hardware, down -4.47%.
Today’s Statistics: The declined issues (Decliners) edged out the gaining issues (Advancers) on Friday. The ratio of Advancers to Decliners was 1.01-to-1.0, or in practical terms, for every Decliner there was an Advancer. In real numbers, 727 Decliners to 719 Advancers with 127 Unchanged. The total volume of shares traded for gaining stocks was 132,980,403 or 39.2%; the total volume for declined stocks was 189,613,059 or 55.9% and 16,717,971 or 4.9% for “Unchanged”.
There were 328 new 52-Week Highs and 16 new 52-Week Lows. This is really bullish.
The total volume of stocks traded at the TSX today was 339,311,433 compared to 311,673,853 yesterday, a three percent decrease. Today’s volume of 339,311,433 was higher than the average of the ten most recent market sessions.
The Toronto market may finally be catching up with the US indexes which have been continually hitting new highs during the past few weeks. The rally does not appear to have the same staging power as the US indexes. The number of declined stocks were just about the same as the gaining stocks, however, the volume of shares traded was 42% higher. The TSX index declined on Friday while the volume increased almost 9% compared to Thursday. That is bearish.
.
The US Markets
![]()
All three US indexes declined on Friday. The Dow Jones Industrial Average declined -68.66 points, or -0.18%, to close at 38,722.69. The S&P 500 declined -33.67 points, or -0.65%, to close at 5,123.69. The Nasdaq Composite was down -188.26 points or -1.16%, to close at 16,085.11. Although Nasdaq closed above the 16,000 level, it was down more than one percent. The rally is currently on “shaky legs”. Nasdaq is extended and, as such, a pullback should be expected. The market, however, will do what it wishes to do.
![]()
Telecommunications Services and Durable Consumer Goods & Services sectors were the top gainers of the US major sectors on Friday. Both were up 0.24%. Financials gained 0.19% and Utilities gained 0.18%. Industrials declined -0.08%; Energy declined -0.22%; Healthcare declined -0.33%; Basic Materials declined -0.52% and Technology declined -1.44%.
The sectors performed better on a weekly basis. Eight of the sectors gained this week. Utilities, up 3.07%, was the top performing sector this week; Financials was up 2.25%; Basic Materials gained 1.46%; Durable Consumer Goods & Services gained 1.23%; Energy was up 0.75% and Industrials gained 0.68%. Technology was down -0.62% for the week.
Rails & Roads – Passengers, up 1.78%, was the top performing industry on Friday. Heavy Electrical Equipment gained 1.71%; Real Estate Operations gained 1.42%; Paper Products gained 1.39% and Highways & Railtracks gained 1.34%. Retail – Discount Stores and Semiconductors industries were each down -4.52% and were the worst performing industries on Friday.
Today’s Market Statistics: Today, Advancers outnumbered the Decliners on the NYSE. The ratio was 1.25-to-1 or there were five Advancers for every four Decliners. In real numbers, there were 2,197 Advancers to 1,757 Decliners and 318 “Unchanged”. The total volume of volume-gaining stocks was 519,163,909 or 50.9%; the total volume of declined-volume stocks was 485,392,415 or 47.6%; and 16,135,143 or 1.6% “Unchanged”.
Today, Friday, there were 708 new 52-Week Highs and 48 new 52-Week Lows. Yesterday, there were 736 new 52-Week Highs and 47 new 52-Week Lows. The market remains bullish. The rally seems to be alive but there is some rotation away from AI and the big tech stocks. The small caps gained this week while Dow was down 1% for the week.
The total volume of stocks traded at the NYSE today was 1,020,691,467 compared with 1,094,495,979 yesterday, a seven percent decrease. Today’s volume of 1,020,691,467 is about one per cent higher than the average of the ten most recent market sessions.
On the NASDAQ, the Decliners prevailed over the Advancers today by a ratio of 1.05-to-1 or roughly for every Decliner there was an Advancer. In real numbers, there were 2,192 Decliners to 2,086 Advancers with 350 unchanged. The total volume of volume-gaining stocks was 2,983,526,638 or 53.9%; the total volume of declined-volume stocks was 2,512,485,606 or 45.4% and 38,408,672 or 0.7% for “Unchanged”.
There were 351 new 52-Week Highs and 83 new 52-Week Lows. The NASDAQ is extended. The NASDAQ declined 1.2% for the week.
The total volume of stocks traded at the NASDAQ today was 5,534,420,916 compared to 5,241,819,125 yesterday, an eight percent decrease. Today’s volume of 5,534,420,916 is two percent higher than the average of the ten most recent market sessions.
Oil Price: U.S. crude oil futures fell 2.45% to $78.01 a barrel last week.
10 –year Treasury Yield: The US 10-year Treasury yield closed at 4.087% Friday compared to 4.092% Thursday, while the five-year Treasury yield closed at 4.061%.
The market outlook is Uptrend At Risk – Markets are extended
.
Stocks In The News/Stocks To Watch
The US Markets
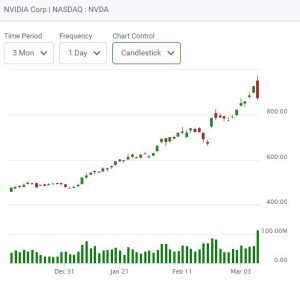
The AI hype may be slowing down or taking a break. NVDIA Corp (NVDA) was down today -5.38%. This was quite a reversal for a stock that tripled in the past one year but what is even more of significance is the volume increase of 125% that accompanied the decline. Some investors were clearly exiting the stock. The stock declined -$51.41 to close the session at $875.28 with a 114.2M shares changing hands.
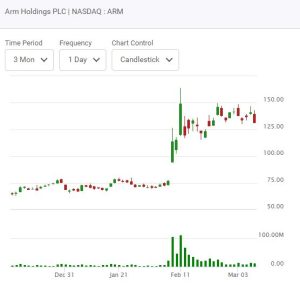
ARM Holdings ADR (ARM) has benefited from AI hype also. The stock was down -6.66%, volume of shares traded was 14.1M down -20% from the previous session’s volume of shares traded. The market was down generally on Friday so a higher ratio of investors were trying to exit their positions in NVIDIA stock than were trying to exit ARM Holdings ADR stock on Friday.
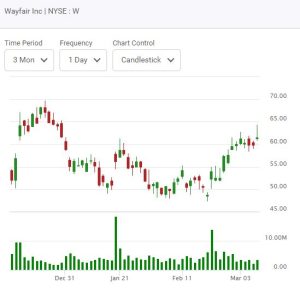
A stock worth adding to the watchlist at least in the short term is Wayfair Inc. (W) The stock is a small cap. On Friday the stock gained 2.81% or $1.68 to close at $61.54 with 3.7 million shares changing hands.
.
Regular Market Day Features
Beginner Investor’s (Canadian stocks) Watchlist
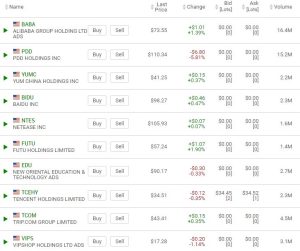
The Canadian Vanguard Chinese Stocks Watchlist
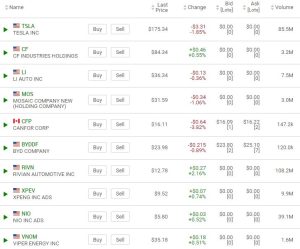
EV, Energy and Resource Stocks Watchlist
IMPORTANT NOTICE
Readers are reminded that the market’s performance at the following day’s market session may completely differ from the market performance at the overnight markets.
SUBSCRIPTION Offer: We thank you for following our Stock Market posts but please be aware that we shall soon be restricting these articles to subscribers only.
We do not send this publication by email to readers. If you receive a copy by email please simply forward the email to us.
Our reports are composed by humans after proper analysis and detailed research. It is neither AI nor machine generated. We do not, like AI, make things up.