


The Stock Market At Close – Tuesday, August 15
![]()
The Toronto Market
The TSX composite index declined a portfolio damaging -390.75 points, or -1.9%, at 19,899.79. It is interesting to recall that just two days ago the TSX was on a three consecutive day gaining trend.


The market had been signaling that the indexes might be reaching a temporary climax. The previous big gainers like Tesla and even Apple were kind of hesitating to move. The Today’s Statistics data were becoming repeats of the previous session’s data with very minor changes. We might have arrived at that temporarily climax now.
Today’s market, from an investors viewpoint was a bad as it could ever get,
The culprit today was the inflation data. Officially inflation has not only refused to slow down but it is actually gaining in strength. Report today showed the Canadian inflation rate advanced in July to 3.3%. Analysis of the report also shows that the Bank of Canada was not only fighting inflation but was creating policies that are fueling inflation. Rent increases could be traced directly to factors: interest rate hikes and the idea of importing half a million new immigrants every year. That is bringing in the equivalent of the population of a mid-sized city every year. That will require considerable planning and infrastructure expansion in advance for things to go smoothly.
The Saudi Oil minister blamed speculators for the decline in Oil price weeks ago. May be a new economic strategy is required to fight inflation in modern times. Something other than or in addition to the idea of monetary policy is needed to fight modern day inflation.
Today’s Statistics: Today, the declined issues (decliners) completely outnumbered the gaining issues (advancers). The ratio of decliners to advancers to was 6.22-to-1.00. In real numbers, 194 advancers to 1,207 decliners with 189 unchanged. There were 13 new 52-week highs and 51 new 52-week lows. The total volume of shares traded for gaining stocks was 18,037,054 or 5.8%; the total volume for declined stocks was 286,766,475 or 92.1% and 6,673,805 or 2.1% for “Unchanged”.
The total volume of stocks traded today was 311,477,334 compared to 276,298,853 yesterday. The volume today was 12.7% higher than at the volume at yesterday’s market session. Further analysis reveals the picture of a market session where investors came to sell and definitely not or only reluctantly to buy. We cannot label the situation capitulation yet. It is too early in the process and doing so now will not be technically correct.
The US Market
The Dow Jones index declined -361.24 or -1.02% to end the market session today at 34,946.39 points. The S&P 500 declined -51.86 or -1.16% to end the session at 4,437.86 points and the NASDAQ declined -157.28 or -1.14% to close the market today at 13,631.05 points. The S&P 500 closed below its 50-day moving average for the first time since March.

A US Commerce department report today showed that retail sales grew by 0.7% last month as against the department’s and other people’s expectations of a 0.4% rise. According to that report, the U.S. economy clearly remains strong.
All the ten major US market sectors were in the red today. Basic Materials sector was the worst performing sector with a decline of -3.05%. Discretionary Consumer spending was the best performing sector today. The sector declined the least today, declining by -0.79%. Financials today got some hammering after Moody’s threatened to downgrade some bank ratings. The Financial sector declined -1.79% while Technology declined -1.09% and Energy declined -1.89%.
Nvidia Corp still managed to close with a gain in a choppy session. See the report below understocks in the news. Most other technology stocks closed in the red. Oil was down today also.
Today’s Statistics: Today, declined issues (decliners) totally outnumbered the gaining issues (advancers) on both the NYSE and NASDAQ. The ratio of decliners to advancers on the NYSE was 5.04-to-1. In real numbers, 634 advancers to 3,320 decliners with 262 unchanged. There were 45 new 52-week highs and 129 new 52-week lows. The total volume of volume-gaining stocks was 110,723,440 or 12.8%; the total volume of declined-volume stocks was 742,559,362 or 85.6%; and 14,352,939 or 1.7% “Unchanged”.
The total volume of stocks traded on the NYSE today was 867,635,741 compared 849,009,775 yesterday. The volume of stocks traded on NYSE today was 2% higher the volume yesterday. The ratio of the decliners to advancers is the highest in nine months.
On the NASDAQ, the ratio of decliners to advancers was 2.57-to-1 and difference was more pronounced than on the NYSE. In real numbers, 3,174 decliners to 1,234 advancers with 335 unchanged. There were 66 new 52-week highs and 229 new 52-week lows. The total volume of volume-gaining stocks was 1,857,710,546 or 40.0%; the total volume of declined-volume stocks was 2,695,436,503 or 58.0% and 92,062,490 or 2.0% for “Unchanged”.
The total volume of stocks traded was 4,645,209,539 compared to 4,337,827,426 yesterday. Today’s was 7% higher than the volume yesterday. The volume both today and yesterday were below the normal daily average for NASDAQ.
Oil and the money markets: U.S. crude oil prices fell 1.8% to $80.99 a barrel. China’s economic woes, continues to dominate the reports affect the stocks.
10 –year Treasury Yield: The 10-year Treasury yield rose 4 basis points to 4.22% after spiking to 4.27% in the morning. Currently the yield on the longer term bonds are less the yield on the long term bonds.
Regular Market Day Features
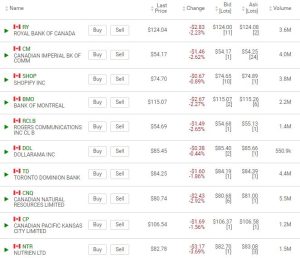
Beginner Investor’s (Canadian stocks) Watchlist
The Canadian banks continue the down trend today. the Royal Bank closed lower than $124. Nutrien Ltd which was flying high has been flying high is now declining but the stock value and the chart remains promising.
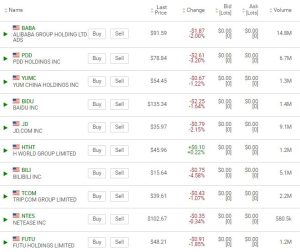
The Canadian Vanguard Chinese Stocks Watchlist
One needs to closely watch the Chinese stocks in our watchlist. It is better to protect capital than to keep wishing the market will reverse trend. The market may not reverse the downward trend until one’s portfolio is totally depleted. We have no way to predict when the Chinese economy will get better.
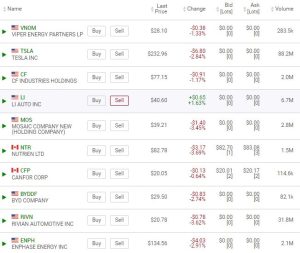
EV, Energy and Resource Stocks Watchlist
Tesla continues to decline while LI Auto is on the uptrend. RIVN and the other Electric vehicles manufacturers continue to trend down.
IMPORTANT NOTICE
SUBSCRIPTION Offer: We thank you for following our Stock Market posts but please be aware that we shall soon be restricting these articles to subscribers only.
We do not send this publication by email to readers. If you receive a copy by email please simply forward the email to us.