


The Canadian Vanguard Stock Market Report At Close – Wednesday, February 21, 2024
.
Data Driven Market Analysis And Report For Tomorrow’s Winning Trades
.
The Toronto Market
![]()
The TSX composite index declined -45.15 points or -0.21% to close today’s market session at 21,172.38.


Only four of the ten TSX major sectors ended the session in green. Energy took the lead. Oil price has been trending up slowly but steadily for the past two weeks. Energy sector was up 1.85% today. Discretionary Consumer Goods & Services was up 0.42%; Utilities was up 0.23% and Healthcare was up 0.05%.Basic Materials declined -0.58%; Financials declined -0.62% and Technology was down -1.61%
Computer Hardware was the top performing industry today with a robust 15.95% gain. Textiles & Leather Goods gained 7.14%; Apparel & Accessories was up 3.34%; Oil & Gas Exploration & Production gained 3.15% while Construction Materials gained 3.03%.
Today’s Statistics: The declined issues (decliners) edged out the gaining issues (advancers) today. The ratio advancers to decliners was 1.44-to-1.0 or in practical terms, for every seven decliners there were five advancers. In real numbers, 870 decliners to 604 advancers with 130 Unchanged. The total volume of shares traded for gaining stocks was 158,930,448 or 53.1%; the total volume for declined stocks was 128,454,429 or 43.0% and 11,665,777 or 3.9% for “Unchanged”.
There were 62 new 52-Week Highs and 21 new 52-Week Lows.
The total volume of stocks traded at the TSX today was 299,050,654 compared with 341,103,859 yesterday, a 13% decrease. Today’s volume of 299,050,654 was just slightly higher than the average of the ten most recent market sessions.
.
The US Markets
![]()
The US markets were mixed today. The Dow Jones Industrial Average gained 48.44 points, or 0.13%, to close at 38,612.24. The S&P 500 was up 6.29 points, or 0.13%, to close at 4,981.80. The Nasdaq Composite was down -49.91 points or -0.32%, to close at 15,580.87.

The US market was broad-based positive as eight of the major sectors ended the market session in green. Energy was the top preforming sector at the US markets with 1.68% gain. Utilities was up 1.03%; Telecommunication Services was 0.51%; Basic Materials was 0.38%; Industrials sector was up 0.26% and Healthcare gained 0.14%. The Financials sector was down -0.20% and Technology was down -0.57%.
Aluminum was the top performing industry. It was up 4.16%; Coal was up3.135; Oil & Gas Exploration & Production was up 2.36% while Oil & Gas Drilling was up 2.25% and Footwear gained 1.66%.
Today’s Market Statistics: Today, the declined issues (decliners) edged out the gaining issues (advancers) on the NYSE by a ratio of 1.01-to-1 or for every decliner there was an advancer. In real numbers, there were 1,995 decliners to 1,971 advancers and 285 “Unchanged”. The total volume of volume-gaining stocks was 521,928,486 or 54.8%; the total volume of declined-volume stocks was 418,895,333 or 44.0%; and 11,794,231 or 1.2% “Unchanged”.
There were 155 new 52-Week Highs and 50 new 52-Week Lows. The market remains in full rally mode although the bears were definitely present at the market session today.
The total volume of stocks traded at the NYSE today was 952,618,050 compared with 1,038,348,129 yesterday, an 8% decrease. Today’s volume of 952,618,050 is about the average of the ten most recent market sessions.
On the NASDAQ, the decliners outnumbered the advancers by a ratio of 1.88-to-1 or roughly for every nineteen decliners there were ten advancers. In real numbers, there were 2,695 decliners to 1,560 advancers with 304 unchanged. The total volume of volume-gaining stocks was 1,960,739,051 or 38.4%; the total volume of declined-volume stocks was 3,105,134,398 or 60.8% and 40,673,826 or 0.8% for “Unchanged”. The volume for “Unchanged” today was doubled the volume for “Unchanged” on Friday, the last previous market session.
Last Thursday, there were 354 new 52-Week Highs and 53 new 52-Week Lows. On Friday, there were 229 new 52-Week Highs and 66 new 52-Week Lows. Yesterday, there were 111 new 52-Week Highs and 95 new 52-Week Lows. Today, there were 60 new 52-Week Highs and 111 new 52-Week Lows. The bears obviously gained some control today after days of trying. In real terms, it is time to be on the guard as the rally may be weakening and the market may start to trend bearish.
The total volume of stocks traded at the NASDAQ today was 5,732,566,309 compared with 5,327,181,736 yesterday, a 5% increase. Today’s volume of 5,732,566,309 is just one percent higher than the average of the last ten market sessions.
The market outlook remains trade with caution.
.
Regular Market Day Features
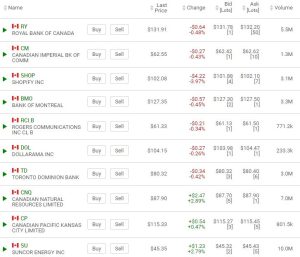
Beginner Investor’s (Canadian stocks) Watchlist
IMPORTANT NOTICE
Readers are reminded that the market’s performance at the following day’s market session may completely differ from the market performance at the overnight markets.
SUBSCRIPTION Offer: We thank you for following our Stock Market posts but please be aware that we shall soon be restricting these articles to subscribers only.
We do not send this publication by email to readers. If you receive a copy by email please simply forward the email to us.
Our reports are composed by humans after proper analysis and detailed research. It is neither AI nor machine generated. We do not, unlike AI, make things up.